Field Data vs. Lab Data: The CrUX Source of Truth
The Core Web Vitals (CWV) report in Google Search Console does not run synthetic Lighthouse audits on your site.
Instead, it evaluates real-world telemetry collected from logged-in Chrome users across the globe through the Chrome User Experience Report (CrUX). Every metric reflects authentic hardware devices, fluctuating 4G/5G networks, and actual user interactions over a 28-day rolling window.
The Three Core Web Vitals Metrics
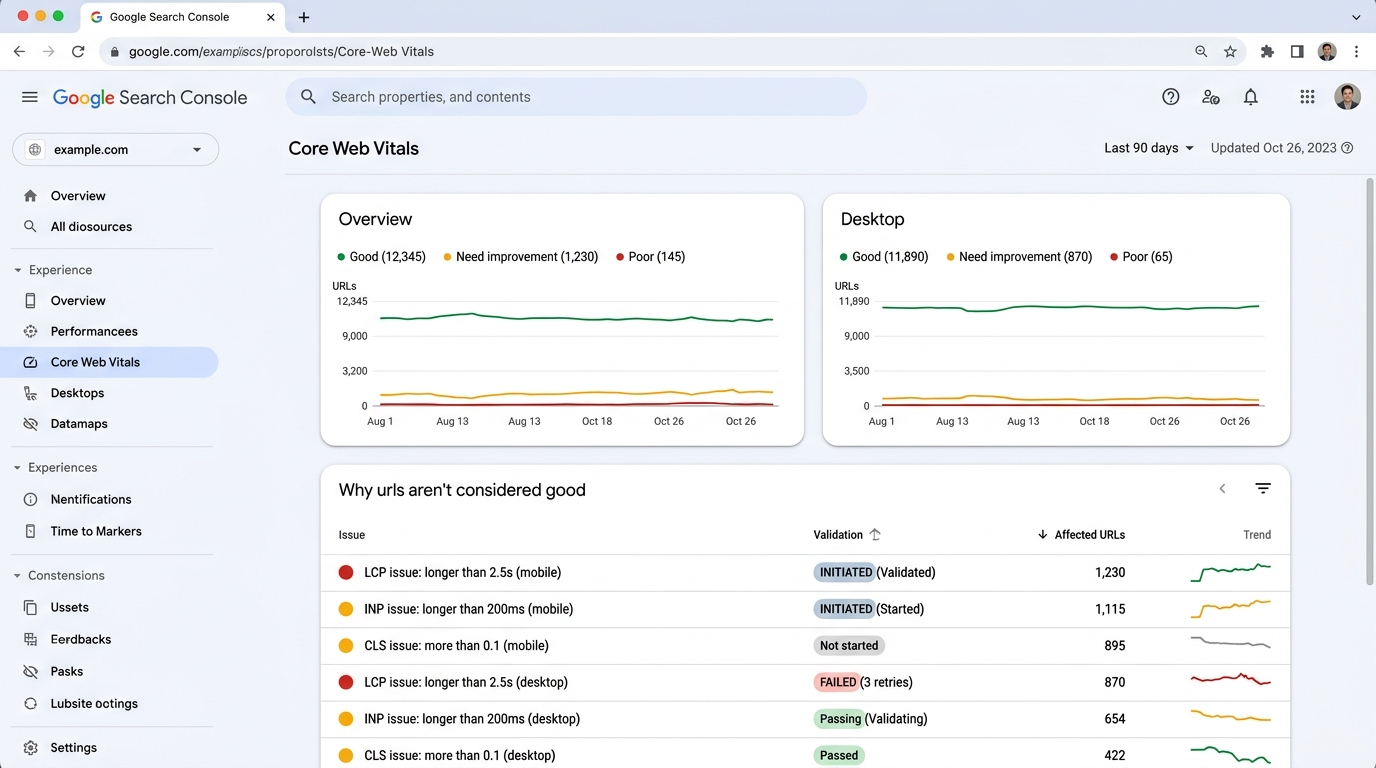 Figure 5.1: The Core Web Vitals report dashboard presenting Mobile and Desktop overview trends categorized into Good (Green), Need Improvement (Yellow), and Poor (Red), along with specific URL group issue diagnostics.
┌────────────────────────────────────────────────────────────────────────┐
│  1. LCP (Largest Contentful Paint): Loading Speed                      │
│     Good: ≤ 2.5s  |  Needs Improvement: 2.5s–4.0s  |  Poor: > 4.0s     │
│                                                                        │
│  2. INP (Interaction to Next Paint): Responsiveness                    │
│     Good: ≤ 200ms |  Needs Improvement: 200ms–500ms |  Poor: > 500ms   │
│                                                                        │
│  3. CLS (Cumulative Layout Shift): Visual Stability                    │
│     Good: ≤ 0.1   |  Needs Improvement: 0.1–0.25   |  Poor: > 0.25    │
└────────────────────────────────────────────────────────────────────────┘URL Clustering & “Similar URLs” Mechanics
Google does not evaluate every low-traffic URL independently for Core Web Vitals. If a specific blog post only receives 50 visits a month, it lacks sufficient CrUX sample size to generate statistical significance.
Google solves this by grouping URLs into URL Clusters (Groups) based on shared architecture and URL patterns (e.g., all URLs under /products/* or /articles/*).
┌────────────────────────────────────────────────────────────────────────┐
│  ISSUE: LCP issue: longer than 2.5s (mobile)                           │
│  GROUP: 4,200 similar URLs share this template bottleneck              │
│                                                                        │
│  IMPLICATION: Fixing the LCP element in the underlying component       │
│  template resolves the issue across all 4,200 URLs simultaneously!     │
└────────────────────────────────────────────────────────────────────────┘
Diagnostic Playbook: Identifying the Culprit
1. Debugging LCP (Largest Contentful Paint)
- Inspect the group’s representative URL in Chrome DevTools Performance panel or WebPageTest.
- Identify the LCP element (usually a hero image, video poster, or large text block).
- Ensure hero images are preloaded with
<link rel="preload" as="image" href="..." fetchpriority="high">. - Prevent lazy loading on above-the-fold images! (Do not use
loading="lazy"on LCP images).
2. Debugging INP (Interaction to Next Paint)
- Audit heavy event listeners bound to
clickorpointerdown. - Break up long tasks (>50ms) using
requestIdleCallback,scheduler.yield(), orsetTimeout(..., 0). - Offload non-critical computational work to Web Workers.
3. Debugging CLS (Cumulative Layout Shift)
- Always specify explicit
widthandheightattributes or CSSaspect-ratioon all<img>and<iframe>elements. - Reserve container space for dynamic ad banners and cookie consent banners.
- Avoid injecting dynamic notification bars above the main header after page load.