Google’s Deep Infrastructure Window
Hidden under Settings > Crawl stats lies one of the most powerful infrastructure diagnostic tools available to systems architects and technical SEOs: the Crawl Stats Report.
Unlike typical reports that measure searcher clicks, Crawl Stats reveals the raw network-level interaction between Google’s distributed crawler clusters and your web hosting infrastructure over the past 90 days.
The Three High-Level Diagnostic Graphs
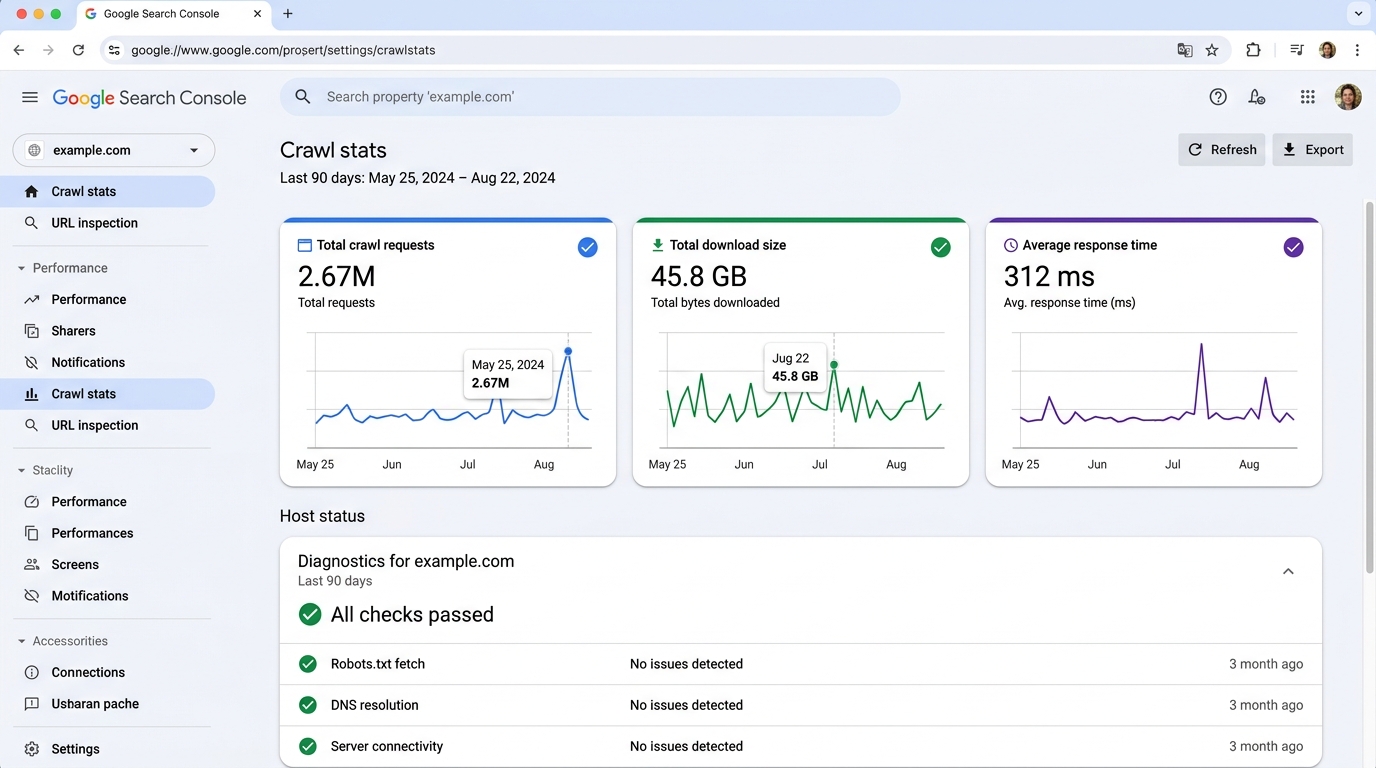 Figure 4.2: The Crawl Stats dashboard displaying Total crawl requests (2.67M), Total download size (45.8 GB), Average response time (312 ms), and the Host status check telemetry.
┌────────────────────────────────────────────────────────────────────────┐
│  1. Total crawl requests: Number of HTTP fetches attempted by Google   │
│  2. Total download size: Total bytes downloaded across all assets     │
│  3. Average response time: Milliseconds elapsed between request & byte │
└────────────────────────────────────────────────────────────────────────┘Host Status: The 90-Day Uptime Gauge
Google assesses whether your hosting infrastructure is capable of sustaining crawls across three critical layers:
┌────────────────────────────────────────────────────────────────────────┐
│                          HOST STATUS CHECKLIST                         │
│                                                                        │
│  [✓] Robots.txt fetch: Did Googlebot encounter 5xx errors reading it? │
│  [✓] DNS resolution: Did your nameservers fail to resolve queries?     │
│  [✓] Server connectivity: Did TCP handshakes or TLS handshakes fail?   │
└────────────────────────────────────────────────────────────────────────┘
If any layer turns red in GSC:
- Robots.txt fetch failure: Googlebot treats a
5xx Server Erroron/robots.txtas a hard stop. It halts all crawling across your entire website because it cannot verify whether crawling is legally permitted! - Server connectivity failure: Indicates dropped connections, SYN timeouts, or aggressive firewall rate-limiting blocking Googlebot IPs.
Crawl Requests Breakdown Analysis
GSC categorizes all crawl events across four distinct dimensions:
1. By Response Code
- OK (200): Should represent 85%+ of requests on a well-architected website.
- Moved permanently (301): High percentages indicate excessive redirect chains being crawled repeatedly.
- Not found (404): Indicates dead internal links or legacy external backlinks wasting crawler bandwidth.
- Server error (5xx): Direct infrastructure alert requiring immediate DevOps investigation.
2. By Purpose
- Discovery: Googlebot crawling a URL for the very first time.
- Refresh: Googlebot recrawling a previously known URL to detect changes.
3. By Googlebot Type
- Googlebot smartphone: Mobile crawler (typically 75%–90% of requests).
- Googlebot desktop: Desktop crawler.
- Googlebot Image / Video: Media-specific indexers.
- Page Resource Load: Headless browser fetching CSS, JS, and font dependencies.
4. By File Type
- HTML, JSON (APIs), Image, Script, CSS, or Other.
Solution: They configured HTTP caching headers (Cache-Control: public, max-age=31536000, immutable) on their static bundles. Once Googlebot cached the scripts, it redirected its crawl capacity to HTML pages, reducing new article indexing latency from 48 hours to under 30 minutes.