The Four Pillars of Search Performance
The Performance Report in Search Console provides the definitive record of how real users discover and interact with your site on Google Search.
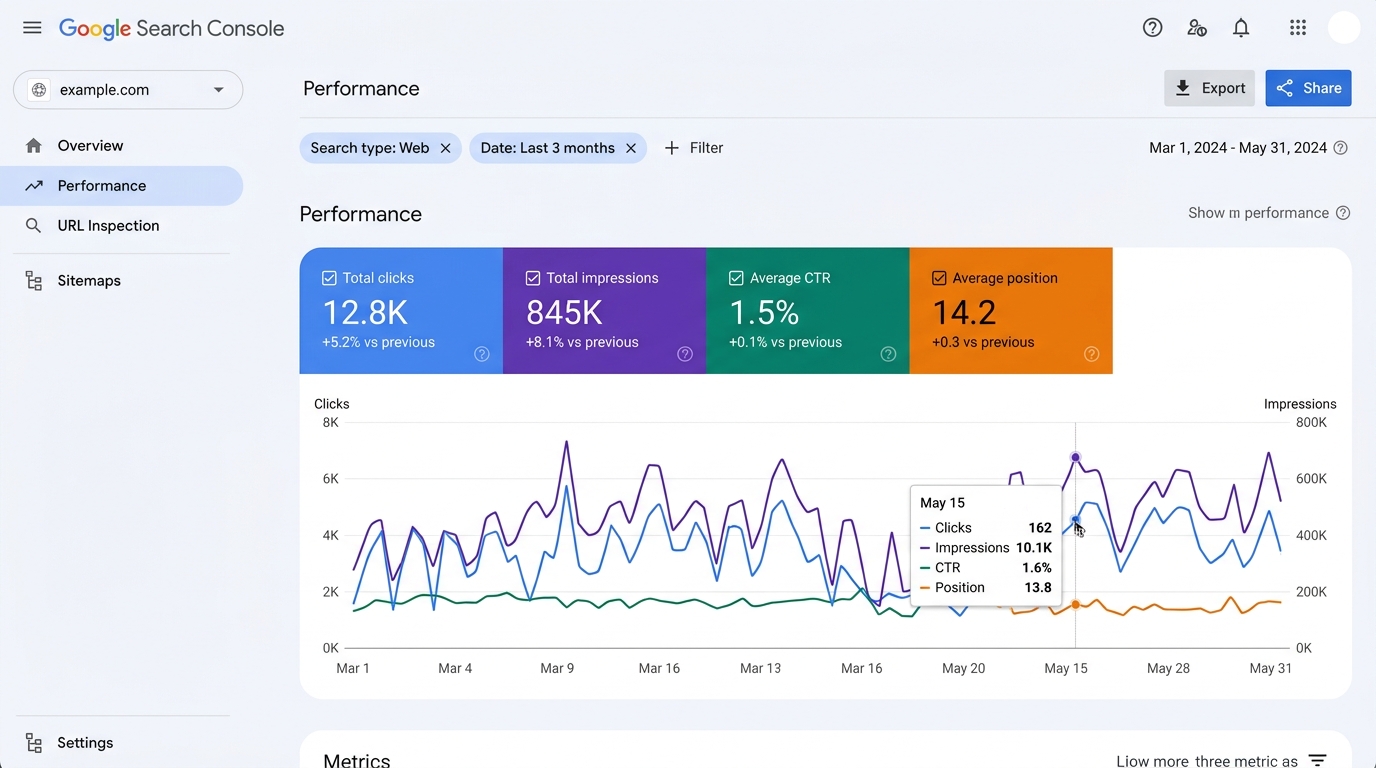 Figure 3.1: The official Google Search Console Performance Report dashboard showing Total Clicks (Blue), Total Impressions (Purple), Average CTR (Green), and Average Position (Orange) with dual-axis timeline graphing.
The dashboard displays four fundamental metrics across four primary tabs:
- Total Clicks
- Total Impressions
- Average CTR (Click-Through Rate)
- Average Position
Metric Breakdown & Hidden Nuances
1. Impressions (The Viewport Requirement)
An impression is recorded every time a link URL from your site appears in a search result for a user.
- Desktop Standard: The link must either be visible on the current page or scrolled into the user’s viewport.
- Infinite Scroll / Continuous Mobile Scroll: An impression is only recorded once the item scrolls into the visible screen area. If your site ranks #18 and the user stops scrolling at #10, zero impressions are recorded.
- Carousels & Knowledge Panels: Multiple links to the same domain in a single SERP feature (e.g. Sitelinks) count as one single impression at the site level, but distinct impressions when querying by Page dimension.
2. Clicks (Actionable Intent)
A click is recorded any time a user clicks a link on Google that directs them to an external webpage on your site.
- Clicking a link that simply expands an internal accordion or query suggestion (e.g. “People Also Ask”) does not count as a click.
- If a user clicks your link, returns to Google, and clicks the same link again within seconds, Google debounces this as one single click.
3. Average CTR (Click-Through Rate)
The formula is straightforward: $$\text{CTR} = \left( \frac{\text{Total Clicks}}{\text{Total Impressions}} \right) \times 100$$
A high CTR indicates compelling title tags, descriptive meta snippets, or rich snippet enhancements that draw user attention.
4. Average Position (The Arithmetic Mean Trap)
Position indicates where your link was positioned relative to other search results.
┌────────────────────────────────────────────────────────────────────────┐
│  Rank #1: Top organic blue link                                        │
│  Rank #2 - #10: Remaining Page 1 organic results                       │
└────────────────────────────────────────────────────────────────────────┘Anonymized Queries & Data Gaps
When you sum the clicks of individual queries in GSC, the total rarely equals the Total Clicks card at the top. Why?
Google enforces strict privacy thresholds. Any search query that is:
- Extremely rare or unique (entered by very few users)
- Contains personal names, sensitive information, or private identifiers is classified as an Anonymized Query. Google includes the click and impression in the high-level site totals, but withholds the exact query string from the table to protect searcher privacy.